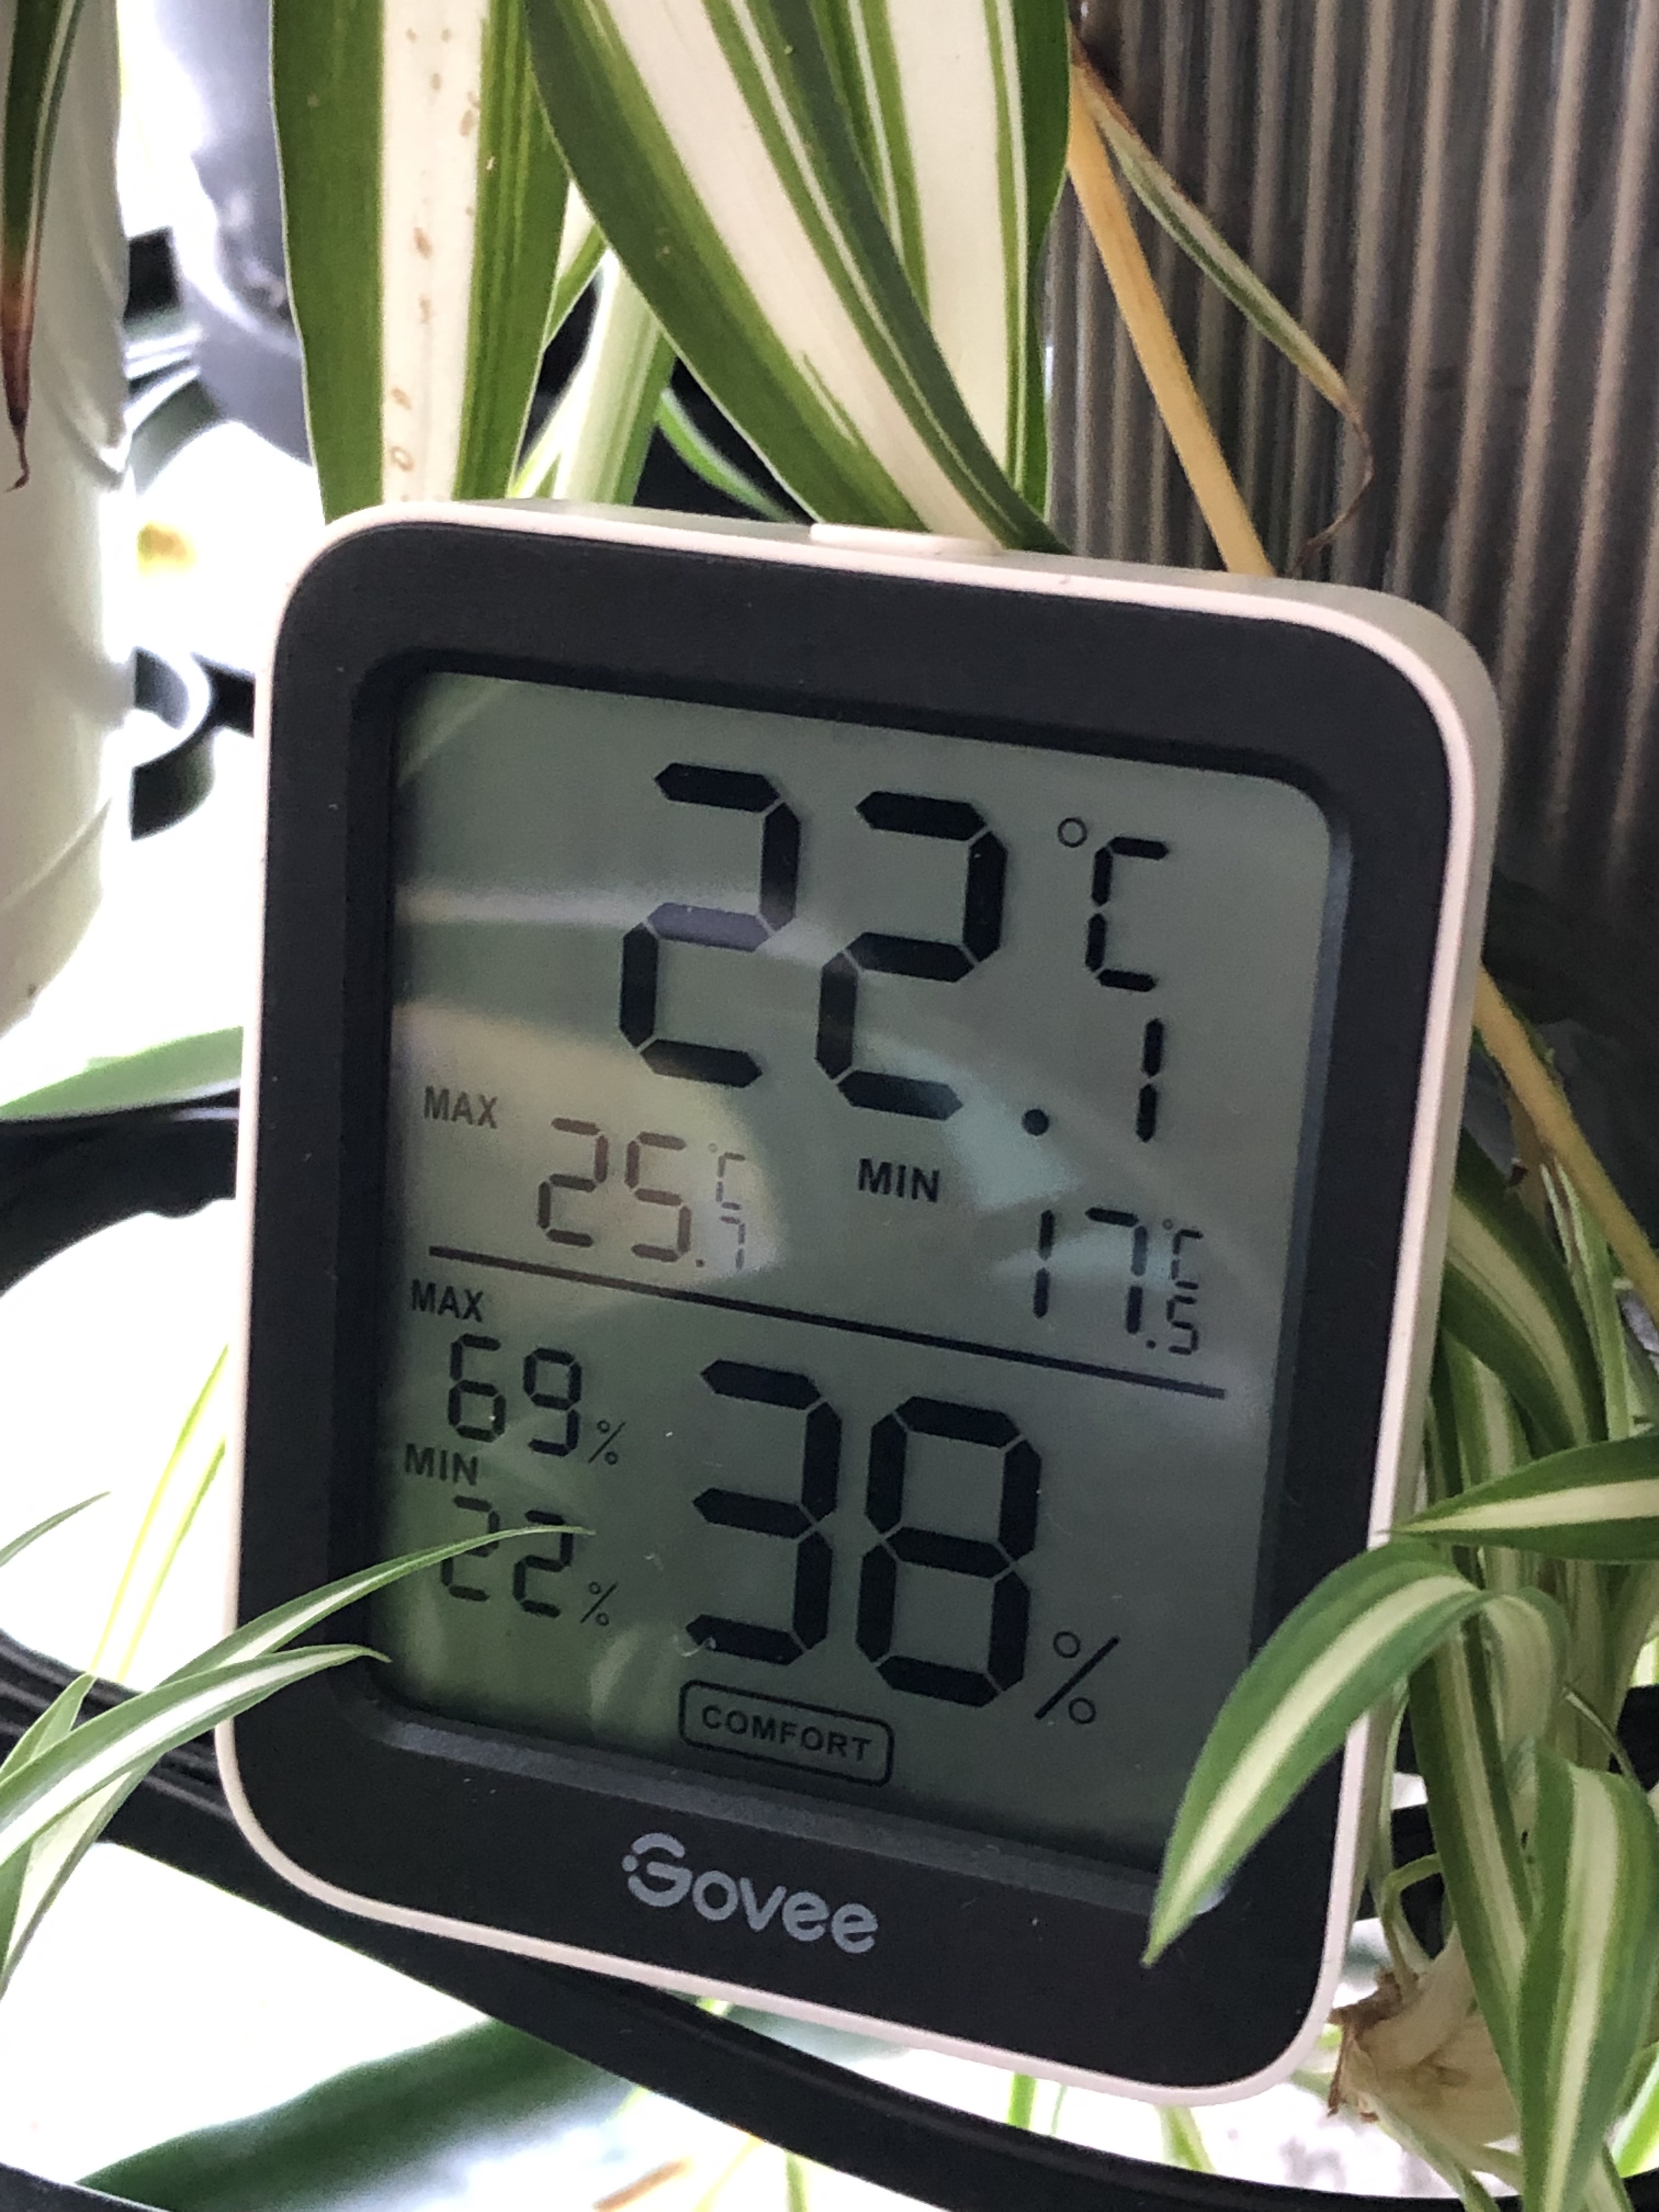
A Govee H5075 sensor nestled among my spider plants
I recently bought these temperature and humidity sensors so I could keep track of conditions around my plants. They have a huge display, good battery life, and they can even keep a 20-day log of measurements, viewable through the accompanying app. However, you need to be physically present and within wireless range to view the data. What’s more, I wanted to export the data to a CSV so I could plot and run analyses with my own tools, but the only way to do that was to create an account and request that they email the data to you. Oh, and you’ll need to remember to sync with it every 20 days so you don’t lose any measurements. No thanks!
Receiving and Decoding the Data
It turns out these temperature sensors communicate using Bluetooth Low Energy (BLE). Using a BLE sniffer app revealed that these sensors continually send out data containing sensor measurements every few seconds. Pretty impressive that they can manage this for several months on just two AAA batteries.
I wrote a simple script to scan for these advertisements and, using some tips from Thrilleratplay’s GitHub project, decode the packets into human-readable data. The actual data we’re interested in only takes up four bytes in the payload. The first three bytes encode a 24-bit integer, where the last three digits are the relative humidity in tenths of a percent, and the remaining digits are the temperature in tenths of a degree Celsius. The battery percentage is represented by the next byte, as an 8-bit integer. I incorporated this into a simple script, based on the Python bleak library, to test this all out:
# Scans for Govee H5075 devices and prints their decoded data to the terminal
import asyncio
from bleak import BleakScanner

def detection_callback(device, advertisement_data):
    # Protocol decoded: https://github.com/Thrilleratplay/GoveeWatcher

    # The "friendly name" that you normally see when pairing with the device
    devname = advertisement_data.local_name
    # Estimated signal quality in dBm
    rssi = advertisement_data.rssi

    # If this is a GVH5075 family device, decode the message
    if devname and "GVH507" in devname:
        payload = advertisement_data.manufacturer_data[60552][1:5]

        # last byte in payload is the battery percentage, as an 8-bit int
        batt = int(payload[-1])

        # temperature and humidity are combined in a 24-bit int
        temphum = int.from_bytes(payload[0:3], "big")

        # uppermost bit is the sign, so we record its state...
        isNegative = (temphum & 0x800000) != 0
        # ... and remove it from further calculations
        temphum &= ~(0x800000)

        # humidity in 10ths of a percent is the last three digits
        hum10 = temphum % 1000
        hum = hum10 / 10

        # temperature is all the other digits, plus the sign information
        temp = (temphum - hum10)/10000
        if isNegative:
            temp *= -1

        print("{0}: {1}°C, {2}%, batt: {3}%, RSSI: {4}"
              .format(advertisement_data.local_name,
                      temp, hum, batt, rssi))
async def main():
    # Initiate a BLE scan with 20s timeout
    scanner = BleakScanner(detection_callback, timeout=20.0)
    await scanner.start()
    # Sleep while the BLE scan is happening
    await asyncio.sleep(20.0)
    await scanner.stop()

asyncio.run(main())
When run, the script produces output that looks like this:
GVH5075_XXXX: 23.7°C, 48.2%, batt: 100%, RSSI: -84
GVH5075_XXXX: 23.7°C, 48.2%, batt: 100%, RSSI: -83
GVH5075_YYYY: 23.1°C, 56.6%, batt: 55%, RSSI: -73
GVH5075_YYYY: 23.1°C, 56.6%, batt: 55%, RSSI: -73
GVH5075_XXXX: 23.7°C, 48.1%, batt: 100%, RSSI: -58
GVH5075_XXXX: 23.7°C, 48.1%, batt: 100%, RSSI: -58
Where XXXX and YYYY are the device IDs for my two sensors. Note that their data appears multiple times in a 20-second period, which gives us a rough idea of how often they send out advertisements. Sometimes the signal can be quite weak and I end up receiving fewer messages, but I found that a 20-second scanning period was enough to ensure I received at least one message from each sensor.
Storing the Data
Now that we have data coming in and decoded, we need a place to put it. I’m not too picky with the data format and I wanted something that I could deploy quickly without any extra infrastructure. I also wanted to view the data remotely so I can keep tabs on my plants when I’m away. So, I decided to just endlessly append my data to a CSV file that gets synced via Dropbox. Yay for cloud storage. I modified the above script to record only one measurement per sensor, and to write the data to a file. The final code can be found on my GitHub, if you’re interested in trying it out yourself.
The Best Compute Module is the One You Already Have
…or at least that’s how I justified running my temperature and humidity logging script on my old MacBook Air. This would be a great application for a Raspberry Pi or other Linux single-board computer, but Raspberry Pi’s are quite difficult to find for reasonable prices at the moment, and I already had my laptop set up as a SLURM cluster to test some jobs for an HPC project, so it’s not like I’m spinning it up just for this project. Plus, it gets much better Bluetooth reception.
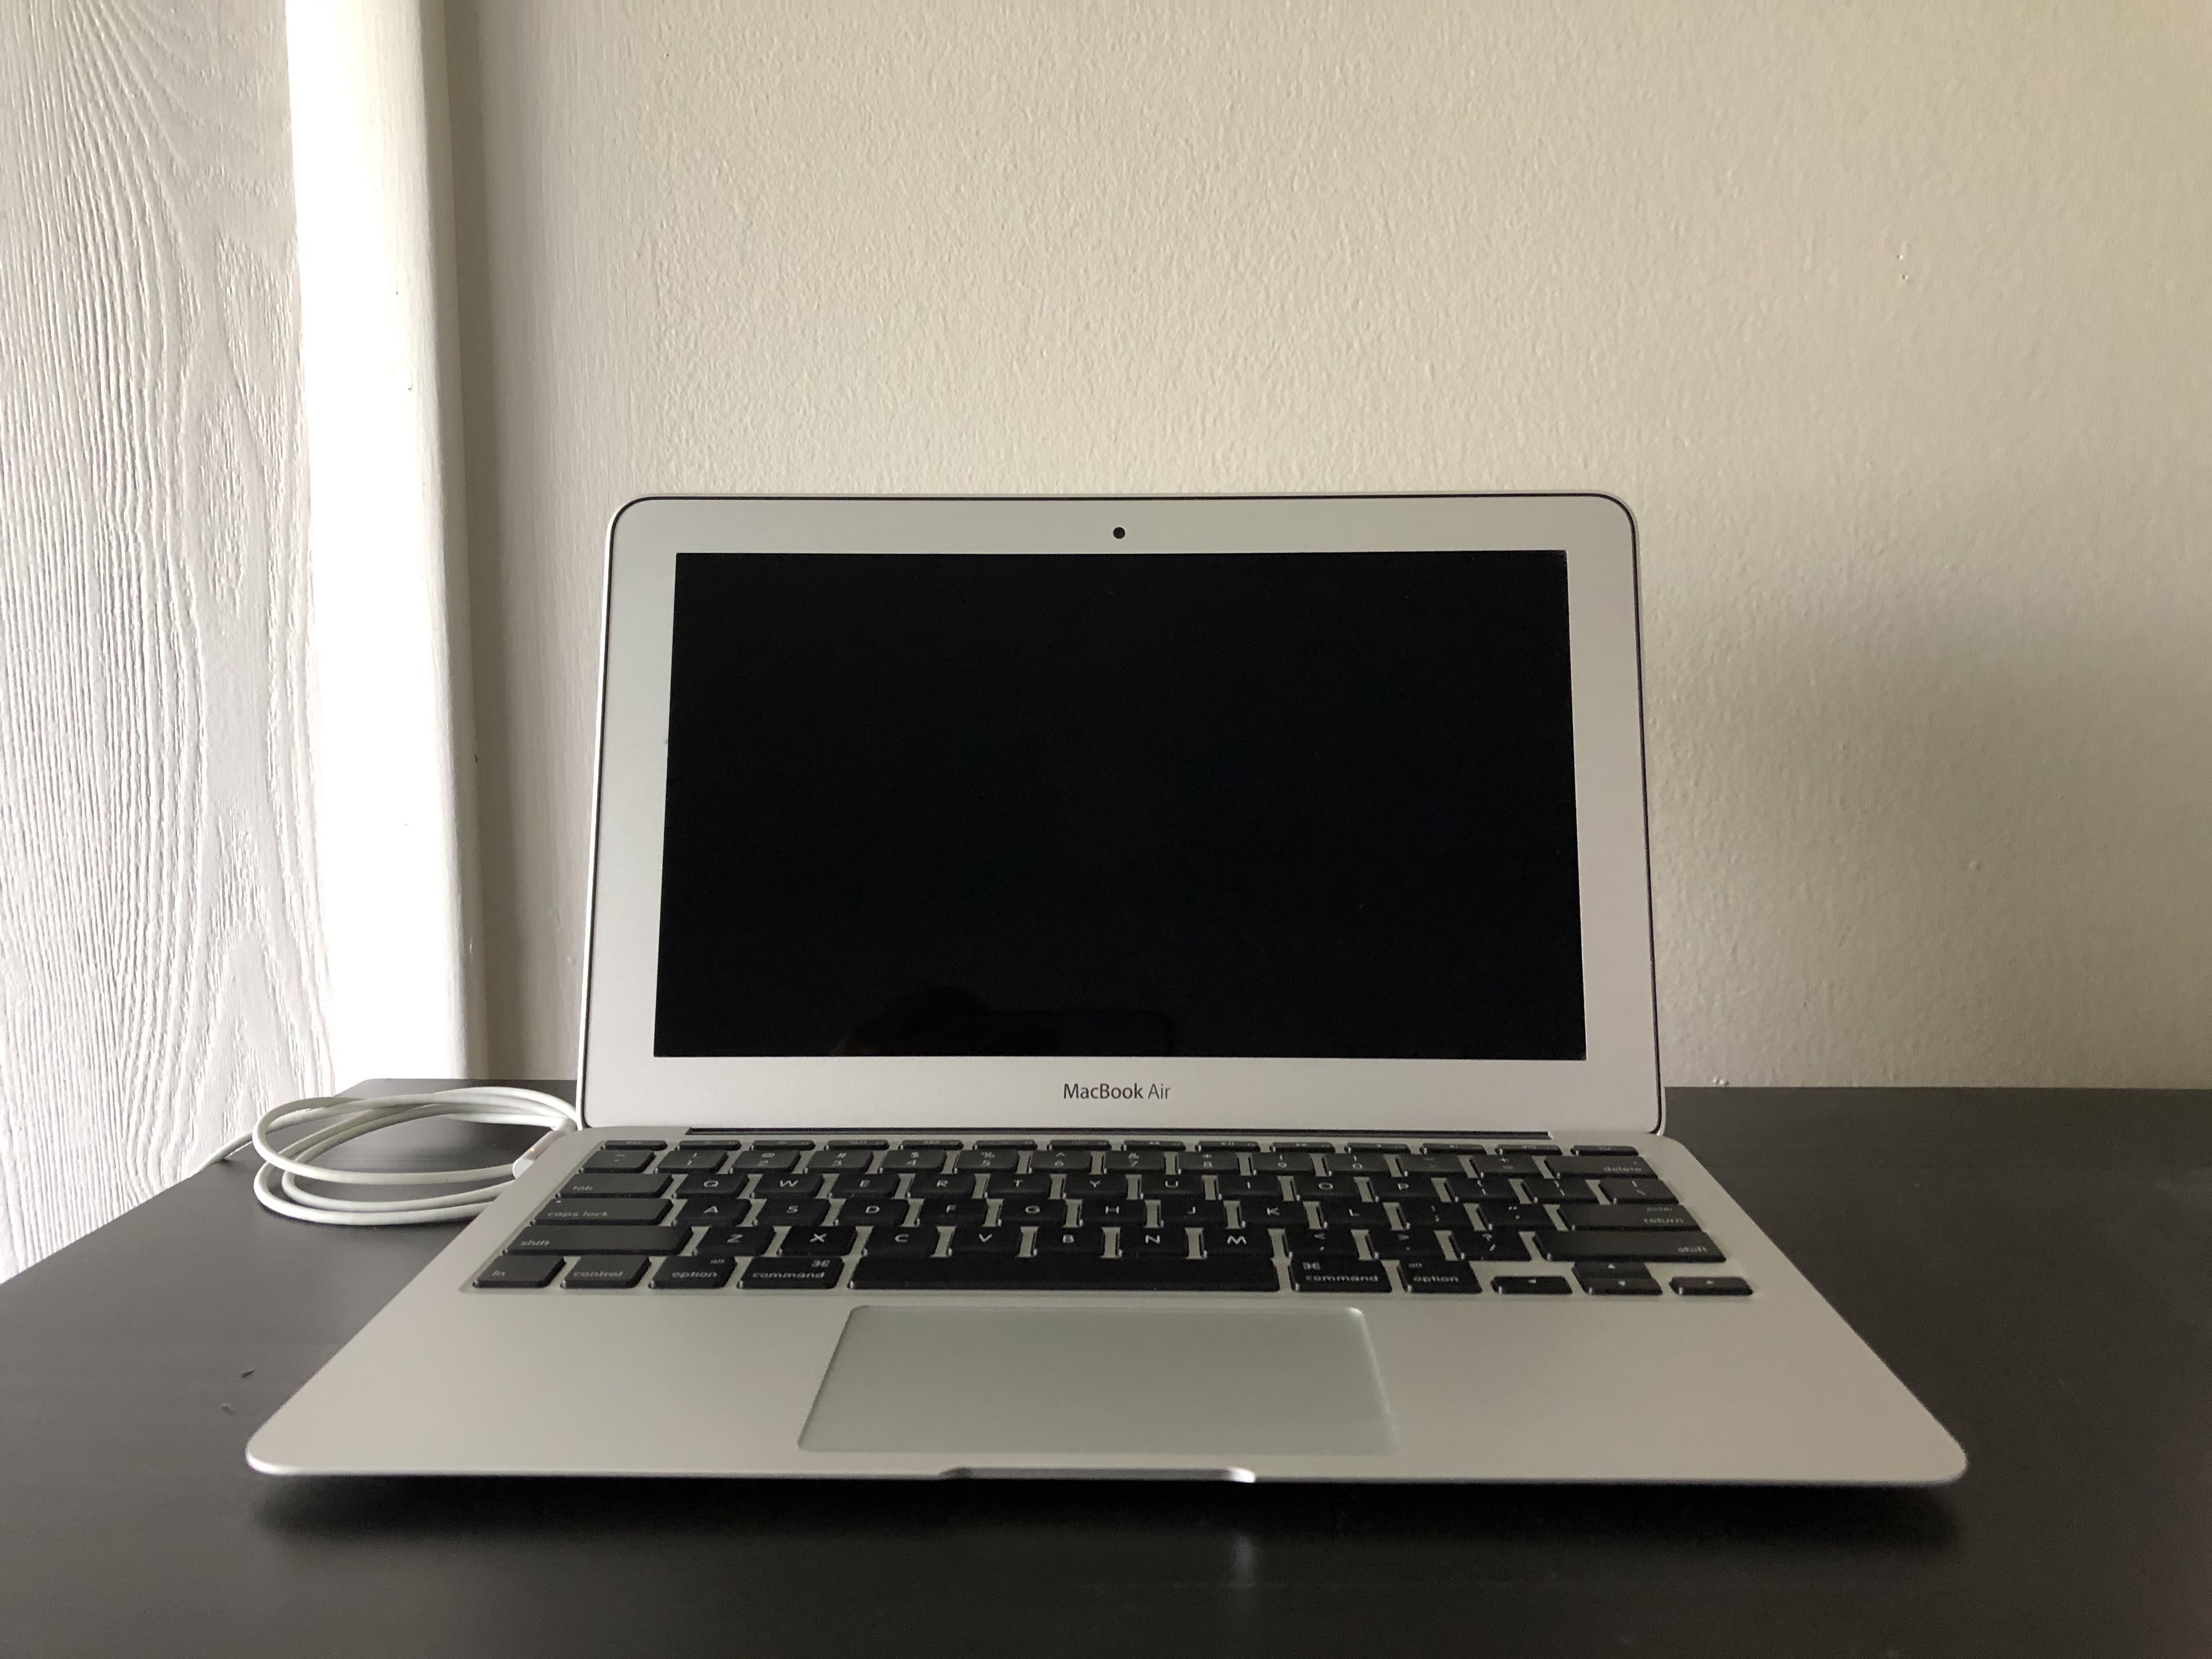
My trusty old MacBook Air is taking on a second job as an IoT hub.
I set up a crontab entry to run my script every 15 minutes on the hour:
*/15 * * * * [username] python3 ~/TempLogger.pyThe original app stores one sample per device every 20 minutes, so my 15-minute resolution would be slightly better. What’s more, the measurements from my sensors would be time-synced to the minute. Based on some back-of-the-envelope calculations, my script would generate approximately 8kB of data per day, or roughly 3MB per year (96 15-minute intervals per day * 42 bytes per message * 2 sensors = 8064 bytes per day). I could probably be even more economical with storage by saving just the raw data, but at the cost of being able to just directly read the log file.
Results
Over the last several weeks, my laptop has dutifully updated the log file with new measurements every 15 minutes, though it occasionally misses a sample every now and then. It happens pretty rarely, and temperature and humidity in place don’t seem to change much within a 15-minute interval, so I’m not too concerned with dropping a measurement or two. It also tends to be one sensor more than the other, and its RSSI is consistently quite low, so it could just be due to weak signal.
One of my favorite ways of quickly visualizing data is with a Jupyter notebook, and it only takes around 30 lines of code to produce a gratuitously fancy twin-axis plot of temperature and humidity over the past few days.
import csv
import matplotlib.pyplot as plt
import collections
from datetime import datetime
times = []
temps = []
hums = []
batts = []
govee_name = "GVH5075_XXXX"
with open('./govee.log') as log:
    reader = csv.DictReader(log, delimiter=',')
    for row in reader:
        if row['name'] == govee_name:
            times.append(datetime.utcfromtimestamp(int(row['time'])))
            temps.append(float(row['temp']))
            hums.append(float(row['humidity']))
            batts.append(float(row['batt']))

lastn = 288 # Only plot the last few samples
fig1, ax1 = plt.subplots()
ax1.plot(times[-lastn:], temps[-lastn:], color='tab:orange')
ax1.set_xlabel('Date')
plt.xticks(rotation=45, ha='right')
ax1.set_ylabel('Temp (°C)')

ax2 = ax1.twinx()
ax2.plot(times[-lastn:], hums[-lastn:], color='tab:blue')
ax2.set_ylabel('RH (%)')
plt.title("Temperature and Humidity")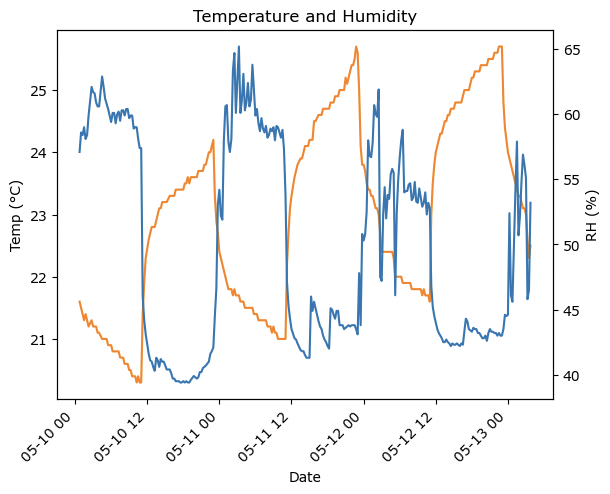
Temperature and humidity data from the last 72 hours
I immediately see a regular pattern in temperature and humidity. I have lights and a fan that switch on during the daytime, and their impact is clearly visible as a daily increase in temperature and decrease in humidity. The smaller spikes throughout the day seem to be caused by the air conditioning system, and I was able to match some of them up with my thermostat’s usage history.
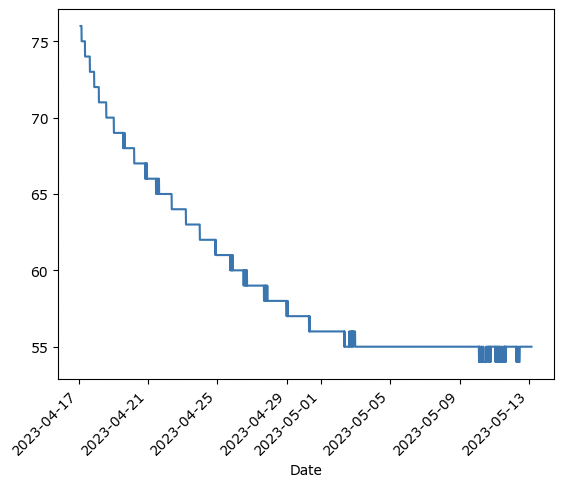
Plotting battery data over several weeks shows a sharp drop at the beginning which then levels out.
The battery data is also interesting to see on a graph. I recently installed rechargeable Ni-MH batteries in one of my sensors, and we can see its characteristically flat discharge curve beginning to take shape after the initial sharp drop. Even though they were fully-charged when I installed them, the sensor reports that its battery level is only at 55%. For comparison, the original alkaline batteries stayed at 100% for weeks before steadily decreasing. This indicates that the battery level might be calibrated for alkaline batteries. Based on how long the last set of batteries lasted, it might be another couple of months before we can see the full discharge curve of the new Ni-MH batteries.
Deliverables
The code for this project can be found at: https://github.com/SomeInterestingUserName/temp-humidity-logger
Future Work
- It would be nice to eventually move away from using my laptop as essentially a ridiculously overpowered IoT gateway. Certainly there are more power efficient methods out there. Plus, having the laptop running 24/7 is bound to put undue stress on the hardware over the long term. My old MacBook Air is old enough that it still has a fan that runs all the time, so it’s slowly getting clogged with dust if I leave it on.
- An app or some dashboard to visualize the data would be cool. Right now, I’m content with just running
tailon the logfile to see the latest measurements, or using my Jupyter notebook, but there are more elegant solutions. - I’d like to eventually switch to a proper IoT platform, maybe something that enables a database-like access pattern. I imagine the log file will quickly grow to unmanageable sizes, and most of it will be accessed quite rarely.